COMPARATIVE GENOMICS

Compare genomes.
Find what differs.

Compare bacterial genomes to study relatedness, shared genes, population structure and features tied to specific research questions.

Pairwise, Multi-genome and Targeted comparisons are available.
View the workflows
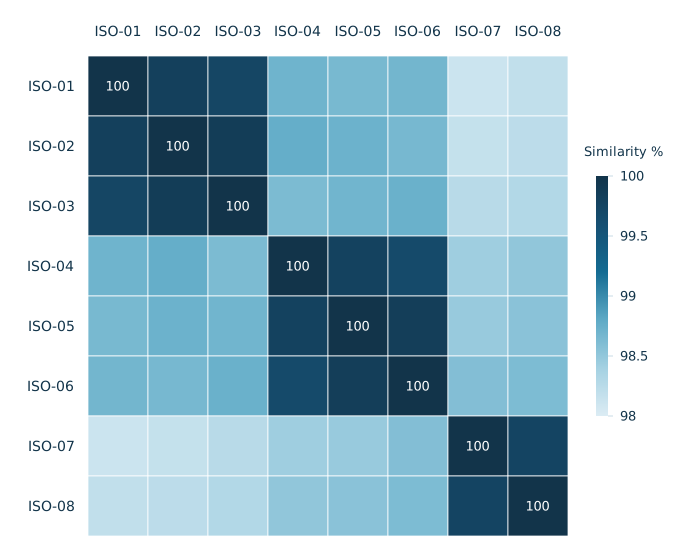
Genome similarityILLUSTRATIVE Illustrative · 8 isolates
Illustrative eight-by-eight genome similarity map. ISO-01 to ISO-08 appear on both axes. Synthetic percentages form darker blue blocks and a 100-percent self-comparison diagonal, with lighter cyan regions between groups. The right-hand Similarity % scale spans 98 to 100. Not an AstroNexus analysis result.

Scroll horizontally when needed to inspect every isolate and the scale.

Illustrative comparative-genomics similarity map for interface demonstration; not an AstroNexus analysis result.
Inspect illustrative similarities

These synthetic percentages and generic isolate labels demonstrate the interface only. No ANI calculation or clustering analysis was performed. Synthetic values and figure notes.

Illustrative similarity percentages; synthetic data, not ANI output
IsolateISO-01ISO-02ISO-03ISO-04ISO-05ISO-06ISO-07ISO-08
ISO-01100.00%99.82%99.74%98.70%98.65%98.68%98.12%98.19%
ISO-0299.82%100.00%99.87%98.76%98.72%98.66%98.17%98.23%
ISO-0399.74%99.87%100.00%98.63%98.69%98.73%98.26%98.30%
ISO-0498.70%98.76%98.63%100.00%99.79%99.68%98.43%98.51%
ISO-0598.65%98.72%98.69%99.79%100.00%99.85%98.47%98.55%
ISO-0698.68%98.66%98.73%99.68%99.85%100.00%98.59%98.62%
ISO-0798.12%98.17%98.26%98.43%98.47%98.59%100.00%99.76%
ISO-0898.19%98.23%98.30%98.51%98.55%98.62%99.76%100.00%

THREE WAYS TO COMPARE

Choose a comparison for your study.

Start with two genomes, a related collection or a focused question about genes and traits.

View sample results
01

Pairwise comparison

Compare two bacterial genomes to assess similarity and identify genes or functions they share or differ in.

InputExactly 2 FASTA assemblies · up to 25,000,000 bytes each

Operational

  • Observed ANI and mapped fragment fraction
  • Matched proteins and pair-specific candidates
  • Assembly and annotation statistics
  • Methods, tool versions and checksums
View pairwise setup
ILLUSTRATIVE
Aligned regions
Illustrative pairwise alignmentTwo genome tracks connected at corresponding regions. Pale outlined regions are distinct in this schematic. No sequence positions or actual alignments are represented.Genome AGenome B
SharedDistinct
Illustrative alignment; not to scale or an analysis result.
02

Multi-genome comparison

Compare 3–20 bacterial genomes to identify core, accessory and genome-specific gene families.

Input3–20 FASTA assemblies · up to 25,000,000 bytes each

Operational

  • Core, accessory and genome-specific families
  • Gene presence and absence
  • Full gene-family presence/absence matrix
  • Assembly and annotation statistics
  • Heatmap and gene-count figures
View multi-genome setup
ILLUSTRATIVE
Shared and variable gene clusters
Illustrative pangenome excerptSix generic isolates and ten example families. F01–F03 are present in every row; F04–F08 vary; F09 and F10 each occur in one row. These are synthetic interface examples, not Panaroo output.F01F02F03F04F05F06F07F08F09F10ISO-01ISO-01 / F01: present · illustrativeISO-01 / F02: present · illustrativeISO-01 / F03: present · illustrativeISO-01 / F04: present · illustrativeISO-01 / F05: present · illustrativeISO-01 / F06: not present · illustrativeISO-01 / F07: present · illustrativeISO-01 / F08: not present · illustrativeISO-01 / F09: not present · illustrativeISO-01 / F10: not present · illustrativeISO-02ISO-02 / F01: present · illustrativeISO-02 / F02: present · illustrativeISO-02 / F03: present · illustrativeISO-02 / F04: present · illustrativeISO-02 / F05: not present · illustrativeISO-02 / F06: present · illustrativeISO-02 / F07: present · illustrativeISO-02 / F08: not present · illustrativeISO-02 / F09: not present · illustrativeISO-02 / F10: not present · illustrativeISO-03ISO-03 / F01: present · illustrativeISO-03 / F02: present · illustrativeISO-03 / F03: present · illustrativeISO-03 / F04: not present · illustrativeISO-03 / F05: present · illustrativeISO-03 / F06: present · illustrativeISO-03 / F07: not present · illustrativeISO-03 / F08: present · illustrativeISO-03 / F09: present · illustrativeISO-03 / F10: not present · illustrativeISO-04ISO-04 / F01: present · illustrativeISO-04 / F02: present · illustrativeISO-04 / F03: present · illustrativeISO-04 / F04: present · illustrativeISO-04 / F05: not present · illustrativeISO-04 / F06: not present · illustrativeISO-04 / F07: present · illustrativeISO-04 / F08: present · illustrativeISO-04 / F09: not present · illustrativeISO-04 / F10: not present · illustrativeISO-05ISO-05 / F01: present · illustrativeISO-05 / F02: present · illustrativeISO-05 / F03: present · illustrativeISO-05 / F04: not present · illustrativeISO-05 / F05: present · illustrativeISO-05 / F06: present · illustrativeISO-05 / F07: not present · illustrativeISO-05 / F08: not present · illustrativeISO-05 / F09: not present · illustrativeISO-05 / F10: not present · illustrativeISO-06ISO-06 / F01: present · illustrativeISO-06 / F02: present · illustrativeISO-06 / F03: present · illustrativeISO-06 / F04: present · illustrativeISO-06 / F05: present · illustrativeISO-06 / F06: not present · illustrativeISO-06 / F07: not present · illustrativeISO-06 / F08: present · illustrativeISO-06 / F09: not present · illustrativeISO-06 / F10: present · illustrative
CoreAccessoryGenome-specificNot present
Illustrative only; not an analysis result.
03

Targeted comparison

Compare selected annotated genes across two or more bacterial genomes.

Input2–20 FASTA assemblies · up to 25,000,000 bytes each · 1–50 gene names or locus identifiers

Operational

  • Target detection calls
  • Matched annotation evidence
  • Genome-by-target matrix and heatmap
  • Report and results ZIP
View targeted comparison
ILLUSTRATIVE
Selected gene inspection
Illustrative selected-target inspectionFour generic isolates and four generic target labels. Gene B is highlighted. Filled circles indicate example annotation matches; empty markers do not establish biological absence.Gene AGene BGene CGene DISO-01ISO-02ISO-03ISO-04
Annotation matchNo annotation match
Illustrative only. Gene B is highlighted; no annotation match does not establish biological absence.